Skip to content
Global Supplement Business Report
Global Supplement Business Report 2024
Global Supplement Business Report
Global Supplement Business Report 2024

Global Supplement Business Report 2024

$3,995.00

The Global Supplement Business Report is your essential resource for understanding the evolving landscape of the dietary supplement market on a global scale. This report provides comprehensive supplement sales data across 13 regions/22 countries, broken down by vitamins/minerals, herbs and botanicals, and sports nutrition products. With over 100 data charts, this report offers a detailed look at international trends that are shaping the industry.

All the sales data (historical, preliminary 2024, and 2025 estimates) is adjusted for local currency, ensuring an accurate view of regional performance.

Key Insights:

  • Fastest-Growing Markets: Latin America and Mexico are growing at a rapid  9.2%, topping the global growth chart. This report reveals what categories are driving this growth, offering a deeper understanding of which emerging markets present the most promising opportunities for expansion.
  • Global Impact of Inflation: Learn about the effects of inflation on the supplement industry worldwide. This year's data provides valuable context on how rising costs are impacting both manufacturers and consumers, and how this economic pressure is disproportionately dispersed across various regions.

By tracking supplement growth around the globe, this report equips readers with the knowledge to understand international trends, identify emerging opportunities, and gain a comprehensive perspective on the dynamics of the global supplement industry.

Regions covered include the United States, Total Western Europe, Eastern Europe and Russia, Japan, China, Canada, India, the Rest of Asia, Mexico, Latin America, Australia and New Zealand, the Middle East, and Africa.

Over 100 Data Charts

22 Countries & Regions

Preliminary 2024 Sales & Growth Data

Raw Data + PPT Slides

Sales, growth, and analysis across these health conditions

Table of Contents

Download the Table of Contents

Executive Overview

China

India

Japan and Rest of Asia

Europe and Russia

Latin America and Mexico

Middle East and Africa

Australia and New Zealand

United States and Canada

Company profiles

Related content

Acknowledgments and definitions

The NBJ model pulls from myriad data sources, outlined in our Methodology. Critical to our outputs are partnerships with SPINS, which powers our retail data and understanding, and ClearCut Analytics, whose Amazon data supports our e-commerce projections.

Powered by

SPINS

Ecommerce model supported by

ClearCut Analytics

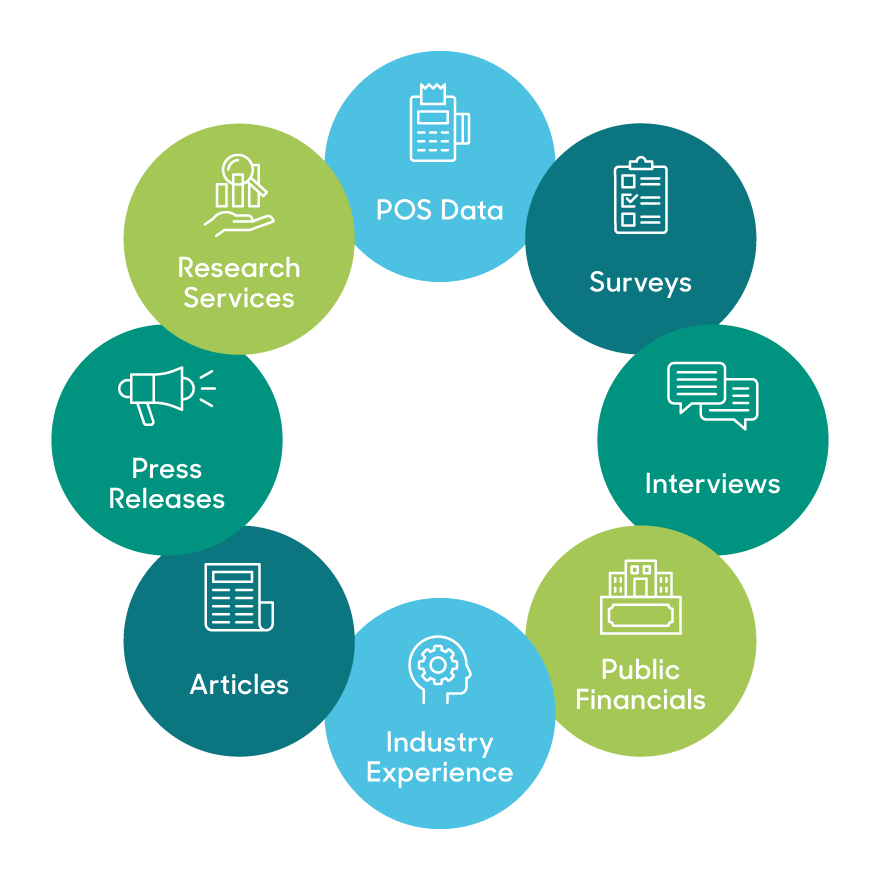
Our unique methodology tells you

  • what people are buying
  • where they're buying it
  • why they're buying it

Learn how this multi-input data model provides a comprehensive view of the industry and delivers the most accurate forecasts 

Explore Our Unique Model

Testimonials

Gaia Herbs

Director, Brand Strategy

"As a brand and product development leader in the natural products industry, I have always relied on NBJ as valuable and primary sources for credible industry data and actionable insights on emerging trends."

Megafood

Director of Marketing

"NBJ Reports are used by our Exec Team, Brand/Mktg/Sales leaders to support data-based decision making and gives us industry and competitive insights."

Native Botanicals

Owner/President

"The data and information vividly reflects the trends, challenges, regulatory impacts we have experienced as we have grown into the ‘adult-hood’ of an industry we are today"

Trusted by:

Glanbia
DSM
Lonza
NOW
Pharmavite

Featured in:

Entrepreneur
Washington Post
Consumer Reports
Fast Company
Yahoo Finance