
Over 150 Data Charts
30 Company Profiles
22 Health Conditions Tracked
Raw Data + PPT Slides
Table of Contents
Access more details for each chapter and its data charts and company profiles.
View the Table of ContentsSales, growth, and analysis across these health conditions
Table of Contents
Download the Table of ContentsExecutive Overview
Beauty from within
Bone health
Brain health
Cold, flu and immunity
Gastrointestinal health
Women’s general health
Men’s general health
Children’s general health
Healthy aging
Healthy sleep
Heart health
Liver health and detox
Joint health
Menopause
Mood and mental health
Pre- and postnatal health
Sexual health
Eye health
Weight management
Company profiles
Related content
Acknowledgments and definitions
179 Charts & Graphs
33 Company Profiles
Top 50 Companies
by US Supplement Sales
9 Chapters of Insights
Sales, growth, and analysis across 6 sales channels
NBJ’s annual report detailing the industry by category and sub-category
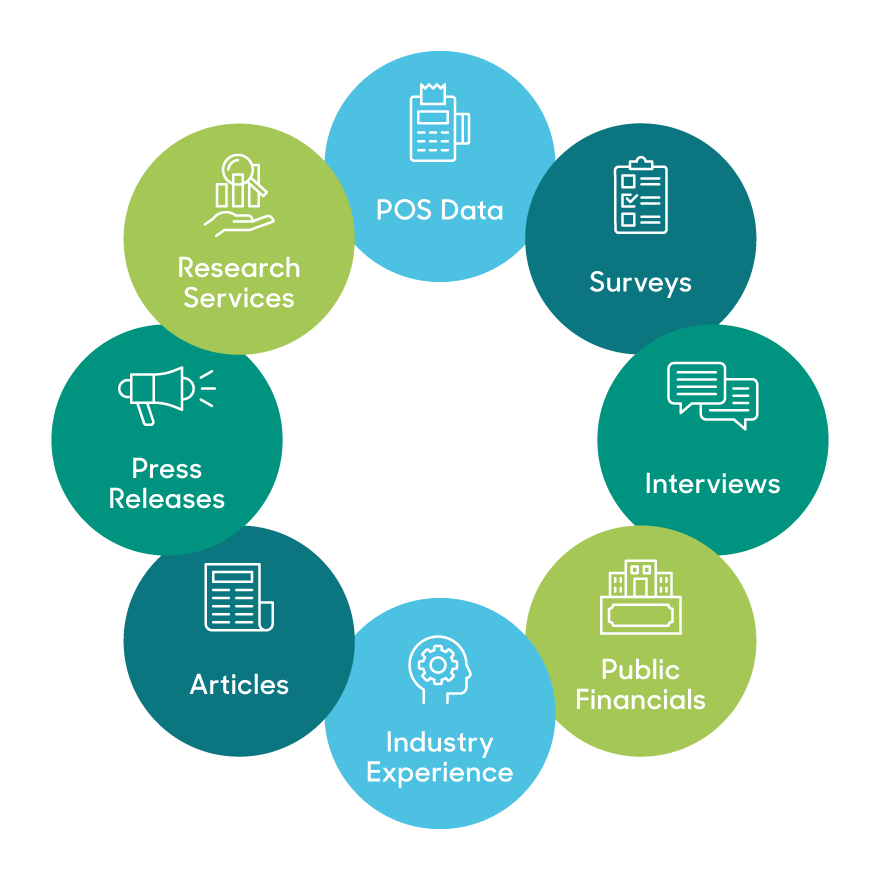
The NBJ model pulls from myriad data sources, outlined in the methodology at the end of this report. Critical to our outputs is our partnership with SPINS, which powers our retail data and understanding and whose Amazon data supports our e-commerce projections.
Powered by

Our unique methodology tells you
- what people are buying
- where they're buying it
- why they're buying it
Learn how this multi-input data model provides a comprehensive view of the industry and delivers the most accurate forecasts
Explore Our Unique ModelTestimonials
Gaia Herbs
Director, Brand Strategy
"As a brand and product development leader in the natural products industry, I have always relied on NBJ as valuable and primary sources for credible industry data and actionable insights on emerging trends."
Megafood
Director of Marketing
"NBJ Reports are used by our Exec Team, Brand/Mktg/Sales leaders to support data-based decision making and gives us industry and competitive insights."
Native Botanicals
Owner/President
"The data and information vividly reflects the trends, challenges, regulatory impacts we have experienced as we have grown into the ‘adult-hood’ of an industry we are today"
Trusted by:


Featured in: