Exclusive Data Charts
See hightlights on top claims
An Expansion on Categories Observed
Enjoy a deeper dive into key categories
Current and Future Target Users
Survey's include an audience of current users and targeted future users
Table of Contents
Click through each tab for an overview of each chapter and its data charts and survey questions.
Download the Table of ContentsExecutive Overview
- Top thoughts
- Improving general health was the top reason for why regular sports nutrition users take sports nutrition products
- Price was the most important for generally active consumers who plan to buy a sports nutrition product in the next year
- Energy and joint support are top reasons occasional sports nutrition users would purchase a new product for support
- $62.9 billion U.S. sports nutrition and weight management industry by category, 2022
- U.S. Sports nutrition and weight management sales and growth, 2018-2026e
- U.S. Sports nutrition and weight management sales by category, 2018-2026e
- U.S. Sports nutrition and weight management growth by category, 2018-2026e
- U.S. Sports nutrition and weight management market share by category, 2018-2026e
- Read more
Sports food and beverage: Functional beverages and bars
- Top thoughts
- 71% of regular sports nutrition users agree they always look for low sugar when selecting hydration or electrolyte products
- Animal-based protein ingredients individually ranked higher than plant-based ingredients
- Functional sports beverages vs. Total sports nutrition and weight management sales and growth, 2018-2026e
- Functional sports beverage sales and growth, 2018-2026e
- $1.3 billion functional sports beverage sales by channel, 2022
- Sports nutrition functional beverage sales by channel, 2018-2026e
- Sports nutrition functional beverage growth by channel, 2018-2026e
- Nutrition bars and gels vs. Total sports nutrition and weight management sales and growth, 2018-2026e
- Nutrition bars and gels sales and growth, 2018-2026e
- $5.7 billion nutrition bar and gel sales by channel, 2022
- Nutrition bar and gel sales by channel, 2018-2026e
- Nutrition bars and gels growth by channel, 2018-2026e
- Huel Ready-to-Drink
- Kate Farms Nutrition Shake
- Soylent Complete Energy
- All Real Protein Bar
- Good To Go Soft Baked Bars
- SlimFast Intermittent Fasting Bar
Sports food and beverage: Hydration and energy
- Top thoughts
- Energy and immune are top reasons for regular sports nutrition users seeking out hydration products
- Recovery from a workout was the primary consumption reason for occasional users of a hydration or electrolyte product
- Half of regular sports nutrition users prefer ready-to-drink bottles and liquids for their hydration products
- Multivitamins are the top daily product that regular sports nutrition users take for support in their active lifestyle or sports performance
- $40.7 billion sports hydration and energy beverages by channel, 20
- Sports hydration and energy beverages sales and growth, 2018-2026e
- Sports hydration and energy beverages sales by channel, 2018-2026e
- Sports hydration and energy beverages growth by channel, 2018-2026e
- Sports hydration and energy beverages market share by channel, 2018-2026e
- Sports hydration and energy beverages vs. Total sports nutrition and weight management industry sales and growth, 2018-2026e
- $15.2 billion sports hydration beverages by channel, 2022
- Sports hydration beverages sales and growth, 2022-2026e
- Sports hydration beverage sales by channel, 2022-2026e
- Sports hydration beverage growth by channel, 2022-2026e
- Sports hydration beverage market share by channel, 2022-2026e
- Sports hydration beverages vs. Total sports nutrition and weight management industry sales and growth, 2022-2026e
- Sports energy beverages sales and growth, 2018-2026e
- $25.5 billion sports energy beverages by channel, 2022
- Sports energy beverage sales by channel, 2022-2026e
- Sports energy beverage growth by channel, 2022-2026e
- Sports hydration beverage market share by channel, 2022-2026e
- Sports hydration beverages vs. Total sports nutrition and weight management industry sales and growth, 2022-2026e
- Roar Organic
- Prime Hydration
- Needed Hydration Support
- Alani Energy
- Oca
- Goli Energy Bites
- Read more
Sports supplements
- Top thoughts
- More than one-third of protein users take protein 3 - 6 times per week
- Highest protein content, no added sugar, and organic are top product attributes to regular sports nutrition users
- Sports nutrition pills and gummies vs. Total sports nutrition and weight management sales and growth, 2018-2026e
- Sports nutrition pills and gummies sales and growth, 2018-2026e
- $394 million U.S. sports nutrition pills and gummies sales by channel, 2022
- Sports nutrition pills and gummies sales by channel, 2018-2026e
- Sports nutrition pills and gummies growth by channel, 2018-2026e
- Sports nutrition protein powders vs. Total sports nutrition and weight management sales and growth, 2018-2026e
- Sports nutrition protein powders sales and growth, 2018-2026e
- Sports nutrition protein powders sales by protein type, 2022-2026e
- Sports nutrition protein powders growth by protein type, 2022-2026e
- All other sports nutrition powders sales and growth, 2022-2026e
- All other sports nutrition powders sales, growth, and market share 2022-2026e
- $7.3 billion U.S. sports nutrition powders by channel, 2022
- Sports nutrition powders sales by channel, 2018-2026e
- Sports nutrition powders growth by channel, 2018-2026e
- Natreve Mooless Whey
- Olly Recover Gummy Rings
- Equate Plant-based Protein Supplement
Weight management supplements
- Top thoughts
- Mass market leads for regular purchasers of sports nutrition products
- Weight management pill supplements vs. Total sports nutrition and weight management sales and growth, 2018-2026e
- Weight management pill supplements sales and growth, 2018-2026e
- $1.6 billion weight management pill supplements by channel, 2022
- Weight management pill supplements sales by channel, 2018-2026e
- Weight management pill supplements growth by channel, 2018-2026e
- Weight management meal supplement vs. Total sports nutrition and weight management sales and growth, 2018-2026e
- Weight management meal supplement sales and growth, 2018-2026e
- $5.9 billion weight management meal supplements by channel, 2022
- Weight management pill supplements sales by channel, 2018-2026e
- Weight management pill supplements growth by channel, 2018-2026e
- Release
- Mdrive Lean
- Sakara Metabolism Super Powder
- Read more
Sales channels
- Top thoughts
- Comparing top information sources for staying up to date on new products between generally active consumers
- $62.9 billion U.S. sports nutrition and weight management sales by channel, 2022
- U.S. Sports nutrition and weight management sales by channel, 2018-2026e
- U.S. Sports nutrition and weight management growth by channel, 2018-2026e
- $6.7 billion U.S. natural and specialty retail sports nutrition and weight management sales by category, 2022
- U.S. Natural and specialty retail sports nutrition and weight management sales and growth, 2018-2026e
- U.S. Natural and specialty retail sports nutrition and weight management sales by category, 2018-2026e
- U.S. Natural and specialty retail sports nutrition and weight management growth by category, 2018-2026e
- U.S. Natural and specialty retail sports nutrition and weight management market share by category, 2018-2026e
- $46.3 billion U.S. mass market retail sports nutrition and weight management sales by category, 2022
- U.S. Mass market retail sports nutrition and weight management sales and growth, 2018-2026e
- U.S. Mass market retail sports nutrition and weight management sales by category, 2018-2026e
- U.S. Mass market retail sports nutrition and weight management growth by category, 2018-2026e
- U.S. Mass market retail sports nutrition and weight management market share by category, 2018-2026e
- $3.4 billion U.S. MLM-network marketing sports nutrition and weight management sales by category, 2022
- U.S. MLM-network marketing sports nutrition and weight management sales and growth, 2018-2026e
- U.S. MLM-network marketing sports nutrition and weight management sales by category, 2018-2026e
- U.S. MLM-network marketing sports nutrition and weight management market share by category, 2018-2026e
- $4.9 billion U.S. e-commerce sports nutrition and weight management sales by category, 2022
- U.S. E-commerce sports nutrition and weight management sales and growth, 2018-2026e
- U.S. E-commerce sports nutrition and weight management sales by category, 2018-2026e
- U.S. E-commerce sports nutrition and weight management growth by category, 2018-2026e
- U.S. E-commerce sports nutrition and weight management market share by category, 2018-2026e
- $1.3 billion U.S. practitioner and fitness club sports nutrition and weight management sales by category, 2022
- U.S. Practitioner and fitness club sports nutrition and weight management sales and growth, 2018-2026e
- U.S. Practitioner and fitness club sports nutrition and weight management sales by category, 2018-2026e
- U.S. Practitioner and fitness club sports nutrition and weight management growth by category, 2018-2026e
- U.S. Practitioner and fitness club sports nutrition and weight management market share by category, 2018-2026e
- $264 million U.S. mail order, DRTV, and radio sports nutrition and weight management sales by category, 2022
- U.S. Mail order, DRTV, and radio sports nutrition and weight management sales and growth, 2018-2026e
- U.S. Mail order, DRTV, and radio sports nutrition and weight management sales by category, 2018-2026e
- U.S. Mail order, DRTV, and radio sports nutrition and weight management growth by category, 2018-2026e
- U.S. Mail order, DRTV, and radio sports nutrition and weight management market share by category, 2018-2026e
- Read more
Appendix
- Generally active consumers have used the following supplements in the last 12 months
- Frequency of consuming sports nutrition products for generally active consumers
- About 12% of generally active consumers who don’t currently use sports nutrition products said they would consider purchasing in the next 12 months
- Adding protein and managing weight top the reasons for occasional users who consume a protein bar, powder, or drink product
- Losing or maintaining weight are top reasons for occasional users who take a meal replacement supplement or product
- Getting through a normal workday is a top reason for occasional users who take an energy supplement or energy drink product
- Regular sports nutrition users turn to social networks to stay updated on new sports nutrition or performance products and ingredients
- Flavor, trust and effectiveness are primary considerations for first time purchase among regular sports nutrition users
- Desirable flavoring, highest grams of protein per serving, and texture were the top 3 reasons for what sports nutrition users look for when purchasing a protein product
- Gym activities, including supporting endurance and increasing muscle mass, rank low as reason regular sports nutrition users take protein
- Improved energy, supporting healthy muscle and joint support were the top 3 claims that would influence regular sports nutrition users to purchase a product for support
- Sports nutrition users prefer the following ingredients for their energy drinks or supplements
- Convenience tops the list of reasons regular sports nutrition users purchase ready-to-drink beverages
- Top preferred types of ready-to-drink beverages for regular sports nutrition users
Company profiles
- 1440 Foods
- Abbott Nutrition
- Beachbody (Shakeology)
- BellRing Brands (including Premier Nutrition, PowerBar, Premier Protein)
- Gainful
- Glanbia (including Amazing Grass, Optimum Nutrition, SlimFast, Think!)
- GNC
- Herbalife Nutrition Ltd.
- Mondelez International, Inc. (Clif Bar & Company)
- Nestlé Health Science (including Atrium Innovations, Boost, Garden of Life, Klean Athlete, Persona, Pure Encapsulations, The Bountiful Company, Nuun, Orgain, Vital Proteins)
- PepsiCo (including Amp, CytoSport, Gatorade, Propel)
- Red Bull
- Simply Good Foods (including Atkins, Quest Nutrition)
- Unilever (including Liquid I.V., Olly Nutrition, Onnit, SmartyPants)
- WM Partners (Vega)
Related Content
- Home work
- Fast tracking
- T time
- Millennials at middle age
- Q&A with Rachita Kenny, certified nutrition specialist
- Reinventing a classic
- Drink up
- Order in the disorder
- Weighting for solutions
- Trading places
- Coexist
- Joining the club
Acknowledgments and Definitions
- Acknowledgments
- Research methodology
- Copyright
- Definitions
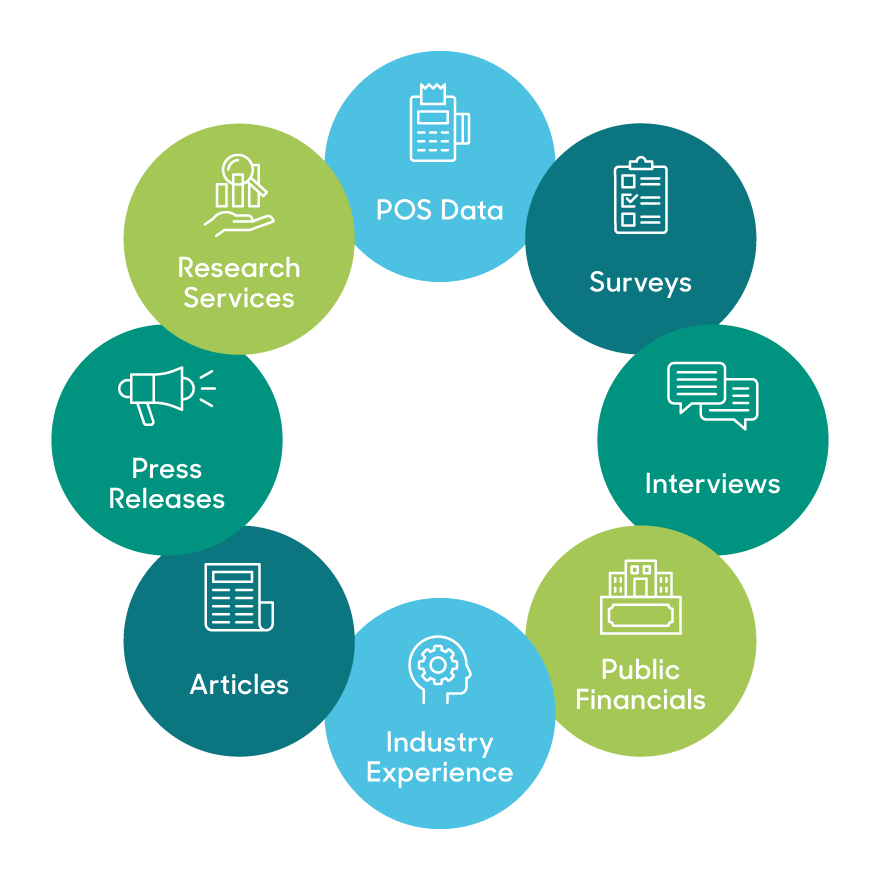
The NBJ model pulls from myriad data sources, outlined in our Methodology. Critical to our outputs are partnerships with SPINS, which powers our retail data and understanding, and ClearCut Analytics, whose Amazon data supports our e-commerce projections.
Powered by

Ecommerce model supported by

Learn More About NBJ
Methodology
Explore our unique modelMeet the Team
See who's behind our dataTestimonials
Gaia Herbs
Director, Brand Strategy
"As a brand and product development leader in the natural products industry, I have always relied on NBJ as valuable and primary sources for credible industry data and actionable insights on emerging trends."
Megafood
Director of Marketing
"NBJ Reports are used by our Exec Team, Brand/Mktg/Sales leaders to support data-based decision making and gives us industry and competitive insights."
Native Botanicals
Owner/President
"The data and information vividly reflects the trends, challenges, regulatory impacts we have experienced as we have grown into the ‘adult-hood’ of an industry we are today"
Trusted by:


Featured in:


